Reports
Build and save reports on your project costs, income, labour and margins, filter them once, and drill into the transactions behind any figure.
Written By Ashraf Ahmed
Last updated 7 days ago
Reports give you real-time visibility of costs, income, labour and margins across your projects. Every report draws on the same set of metrics and filters, so figures always agree with each other, and any figure can be traced back to the invoices, purchase orders and timesheet entries behind it.
1. Opening Reports
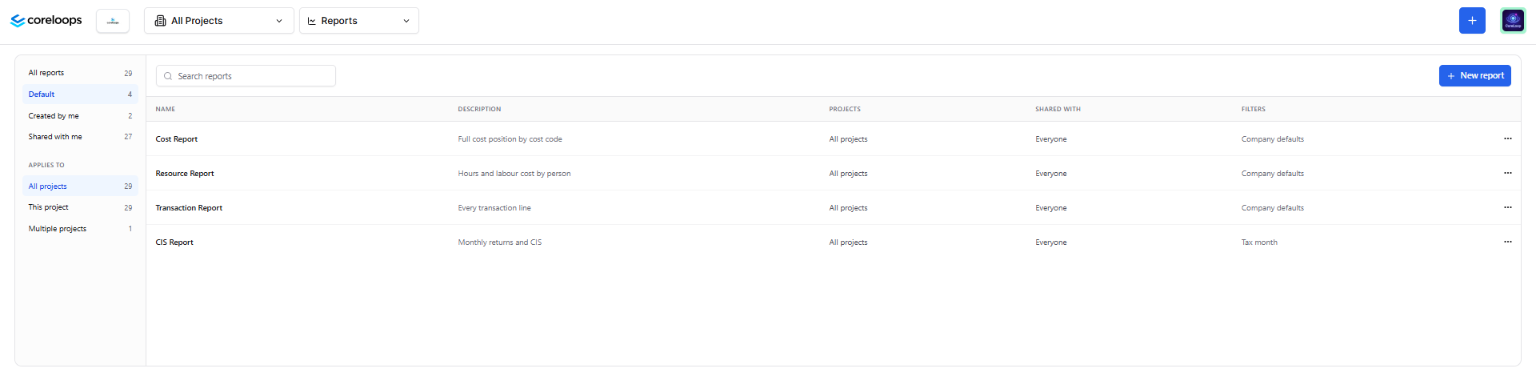
Click Reports in the navigation bar. Reports will open with a list of every report you can see. Each row shows:
the report's name and description
the project or projects it applies to
who the report is shared with
all the filters that have been applied
Click a row to open the report. Use the back link at the top of the report to return to the list.
Coreloops includes default reports, such as a cost report, a resource report and a CIS report. They appear in the list alongside the reports your team creates.
2. Creating a report
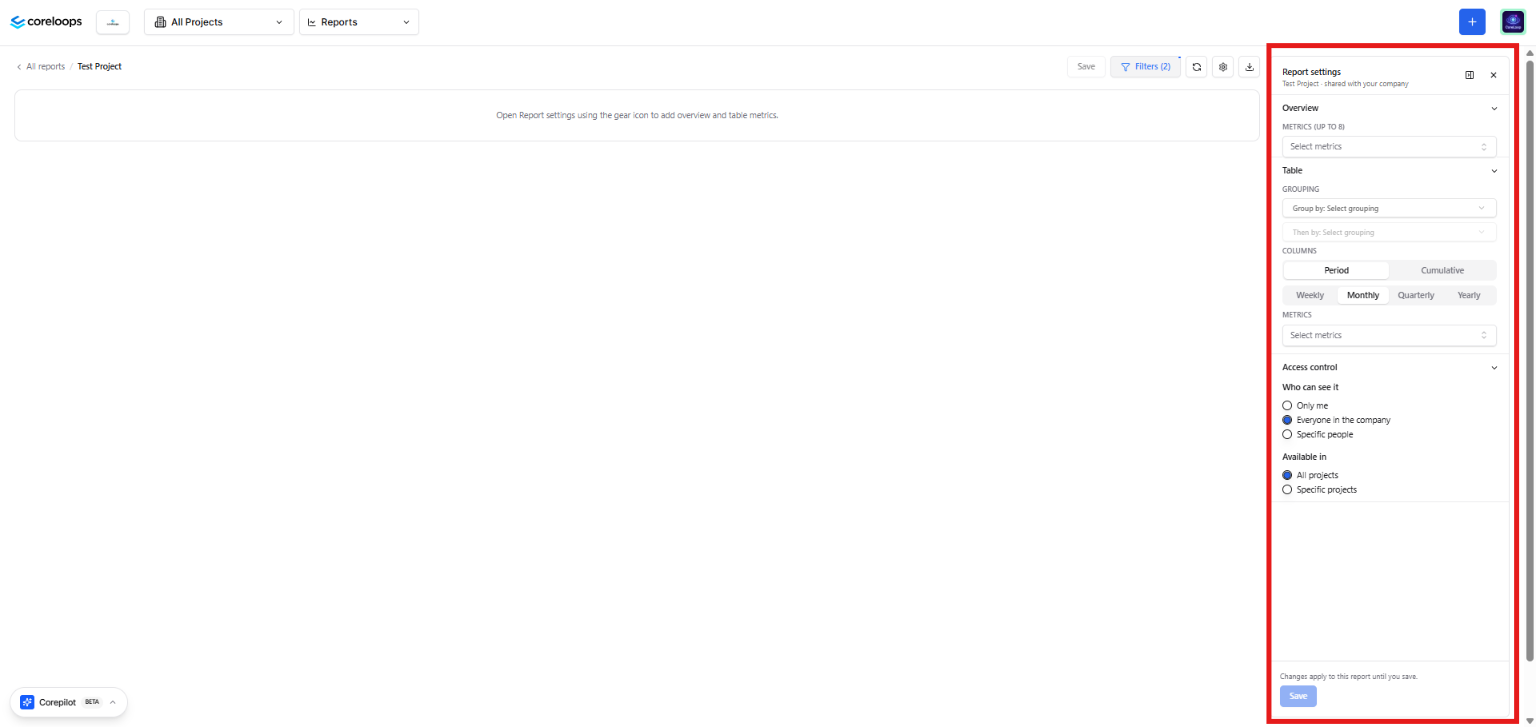
On the Reports list, click to create a new report. The report settings panel opens straight away.
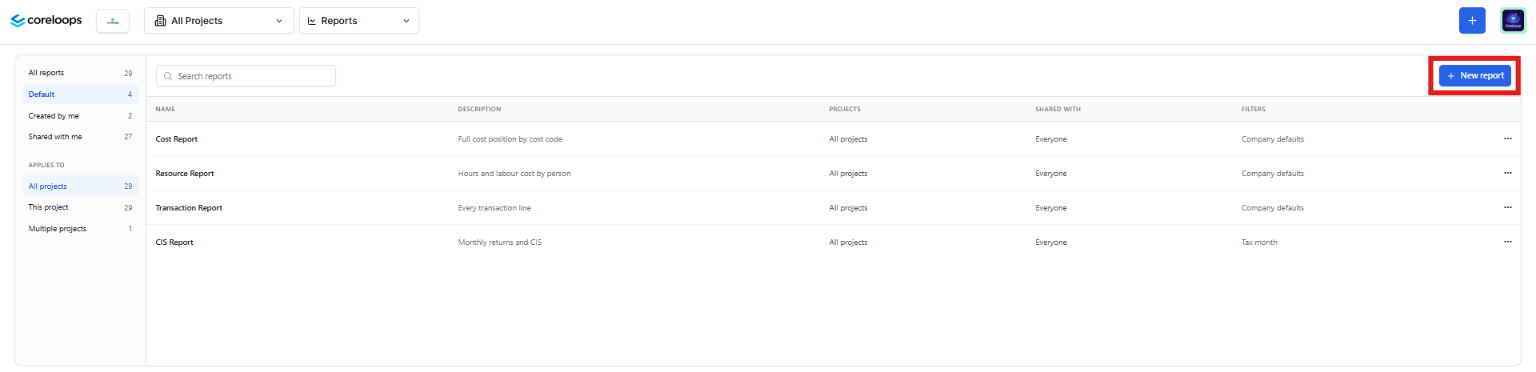
Select New Report in the top right of the screen to create a new report Give the report a name and a short description so others know what it's for. Click Save Report
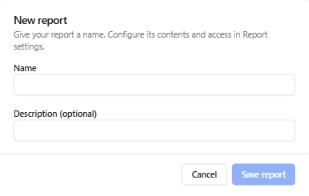
Name the Report and add a description to help describe what the report will cover Choose where the report is available: All projects, or specific projects (see section 7).
Choose your metrics, grouping and filters (sections 3 to 5).
Save the report.
The settings panel sits beside the report and can be collapsed, so you can see the whole report while you change it. If you try to leave a report with unsaved changes, Coreloops warns you first.
3. Choosing metrics
When creating a report, there are two sets of places where you will be able to select Metrics:
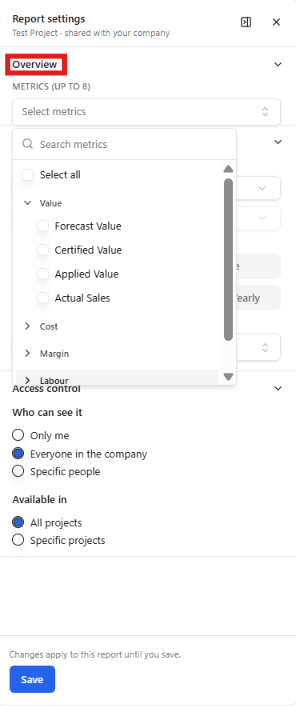
Overview: These are the metrics that will show up at the top of the report and give you a look at the overhead figures

Table: These are the metrics that show in the table that can be grouped and broken down by time periods

Open Select metrics in the report settings for the chosen section to select which metrics appear in the table. Every metric is available in every report, including:
cost and income metrics, such as applied value, certified value, actual costs and margin %
purchase order and invoice metrics, such as committed and invoiced values
labour metrics, such as hours, rates, and standard and overtime pay
Metrics can be selected on their own. As you select metrics they will show up in the report in the left. Dragging metrics in the sidebar allows you to reorder them, for both Overview and Table
4. Grouping
Group the report table by month, metric, cost group, cost code, custom tag or transaction. You can add a sub-group, for example, cost codes under each project.
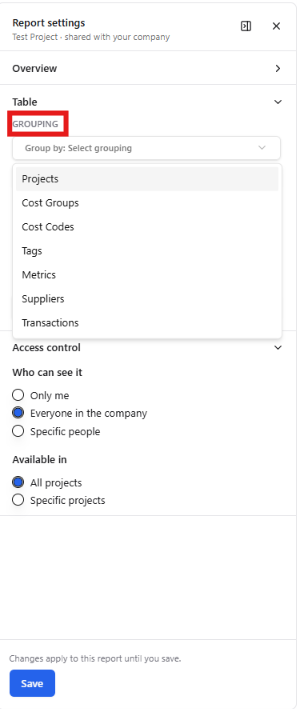
Group by project: see each project, with cost codes or tags beneath.
Group by cost code or cost group: see each metric broken down by code.
Group by tag: break down any grouping further by custom tag.
Group by metric: each metric becomes a group, with its total shown on the group header. Under each metric, you can show cost codes, cost groups, tags or projects.
Group by transaction: list the individual transactions behind your figures. Labour appears as individual timesheet entries alongside invoices and purchase orders, and sales invoices are included.
Any group can be expanded or collapsed.
5. Filters
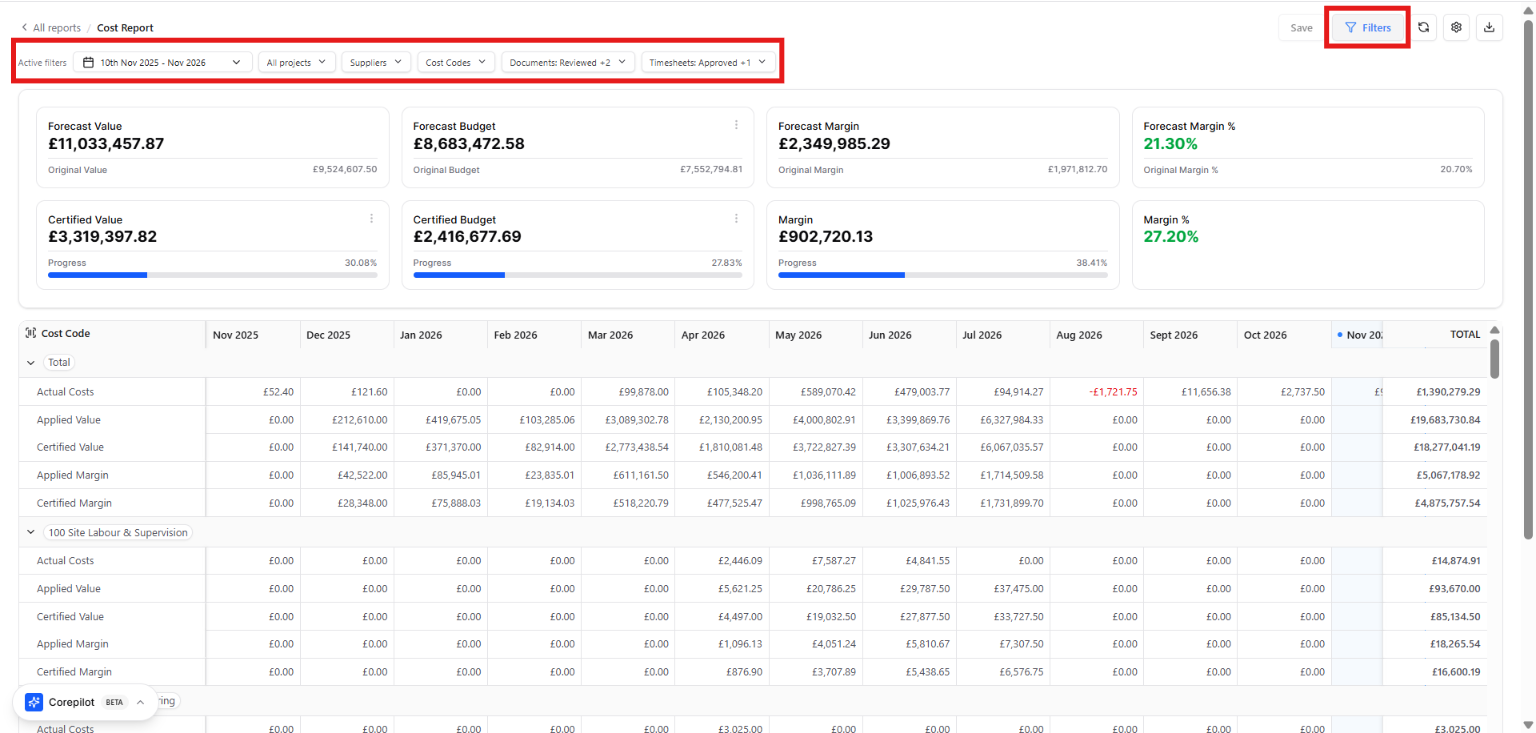
Filters are set once and apply to every metric and grouping in the report. Available filters include date range, project, cost code, supplier, document status and timesheet status.
Status filters only show the statuses that apply to documents or timesheets, and default to Approved.
Every filter in use, including the project filter, shows in the active filters bar above the report. Long lists show the first item and a count. Click Reset to Default to return all filters to the report's saved defaults.
6. Drilling into a figure
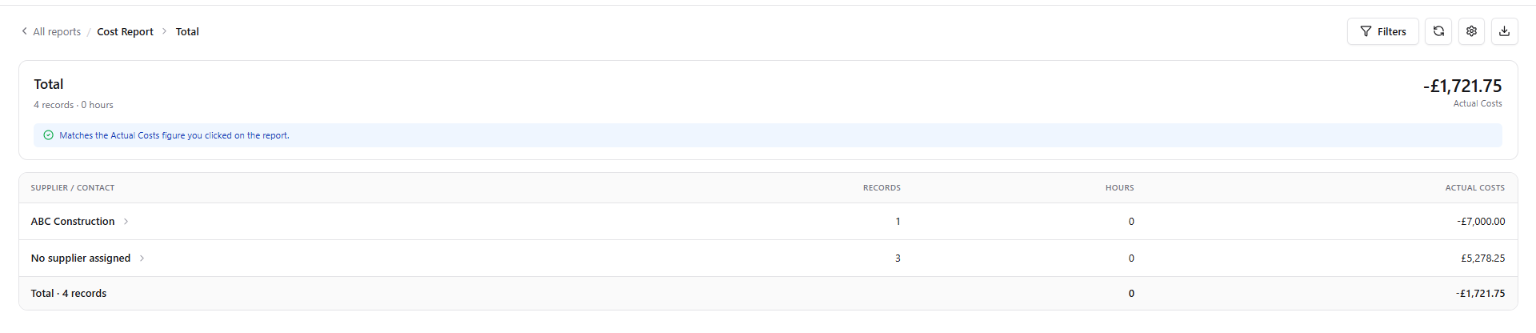
Click any cost grouping, such as a cost group, cost code or custom tag, or one of its figures, to open the transactions behind it in a sidebar. The sidebar keeps the report's project, metric, period and filters, and groups the transactions the same way as the report.

It lists purchase orders, purchase invoices, sales invoices and individual timesheet entries. Document rows show reference, supplier or client, date, status and value. Timesheet rows show the operative, week or date, hours, rate and cost. Click any row to open the underlying record.
Where a document is split across several cost codes, only the part allocated to the selected code is counted.
7. Reports for specific projects
When you create or edit a report, choose whether it is available on all projects or only on specific projects. A report restricted to specific projects only appears in the Reports list while one of those projects is selected, and it shows a project tag in the list. This keeps each project's list free of reports built for other projects.
Only the report's creator and admins can change or remove a restriction. Existing reports stay available on all projects.
8. Overview cards
The top of each report can show up to eight overview cards, in the order you choose. Each card has a comparison picker so you can compare a figure against another period or metric.
9. Saving changes to a report you don't own
You can change filters and grouping on any report you can see. If you don't own the report, save your changes with Save as New View to keep them as your own report. The original is unchanged.
10. Exporting
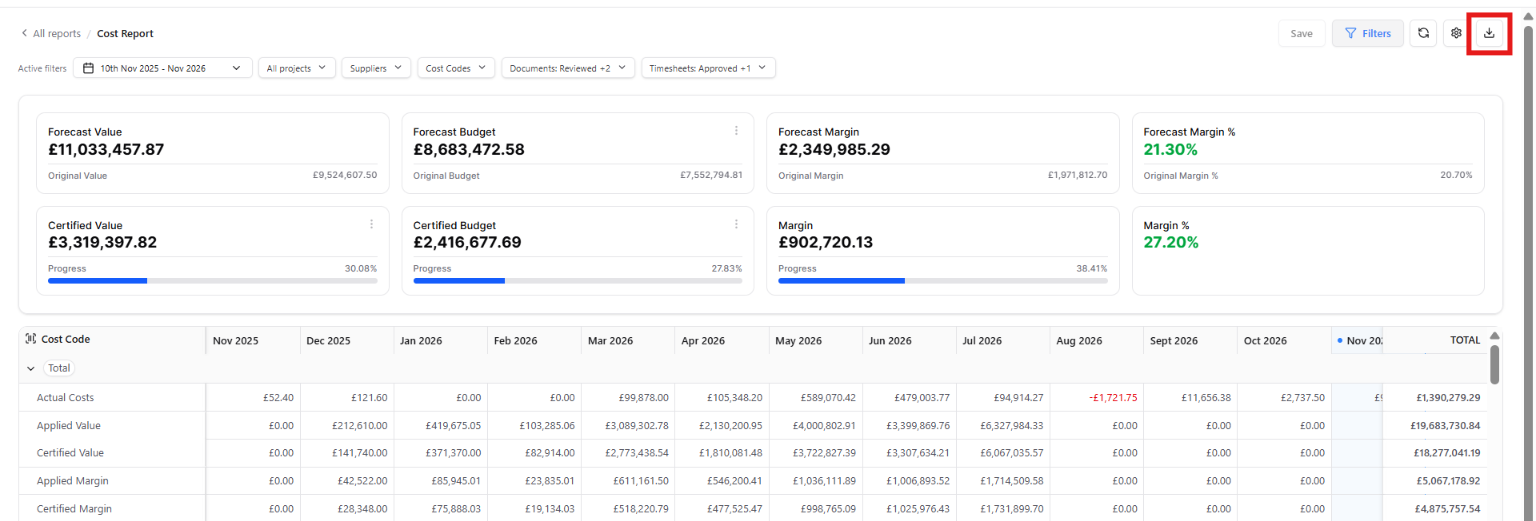
Click Export to download the current report table as a spreadsheet. The export reflects the report's metrics, filters, grouping and project selection.
11. Reporting across all projects
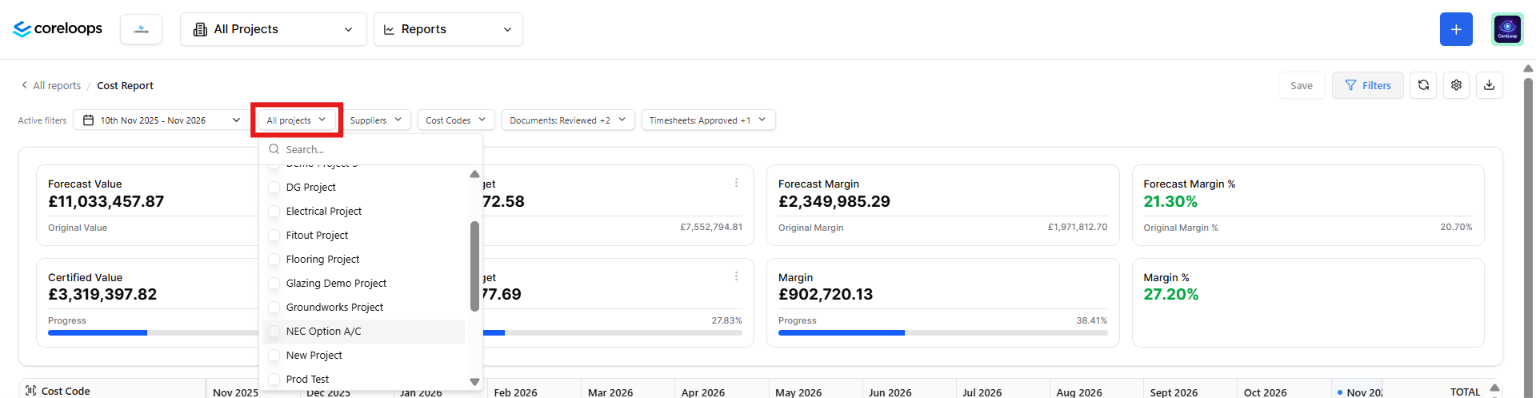
Select All Projects from the project selector at the top of the screen, then open Reports. Figures are added up across every project you have access to. The list shows every report available across all projects; reports restricted to specific projects are hidden until you select one of those projects. Group by project to compare projects side by side.
When you select a single project again, Coreloops takes you back to the screen you last used for that project.
12. What the cost metrics mean
Cost reports compare what you forecast and budgeted against what has actually been certified and spent, so you can manage margins before they slip.
Forecast against original
Forecast Value against Original Value
Forecast Budget against Original Budget
Forecast Margin and Forecast Margin % against Original Margin and Original Margin %
Certified and actual
Certified Value and Certified Budget
Margin and Margin %
Choosing where value and budget come from. For the value, choose Certified Value, Applied Value or Actual Sales. For the budget, choose Certified Budget, Applied Budget or Actual Costs. You can tie these to a specific payment application, so figures line up with your progress claims. Live Margin is worked out from the value and budget you've chosen.
How labour is counted. Labour cost comes from approved timesheets. Timesheet deductions are subtracted from actual cost, so labour cost matches what was paid. When you group by transaction, each timesheet entry appears as its own row, alongside invoices.
Was this helpful?
Still need help? Ask the team